

Weekly Breakdown
Week 1
Etching
Both groups made circuit boards through a chemical process called etching.
Week 2
Week 3
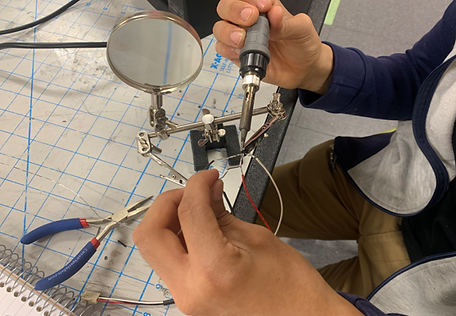
SOLDERING
The teams practiced soldering before populating components on the computer board.
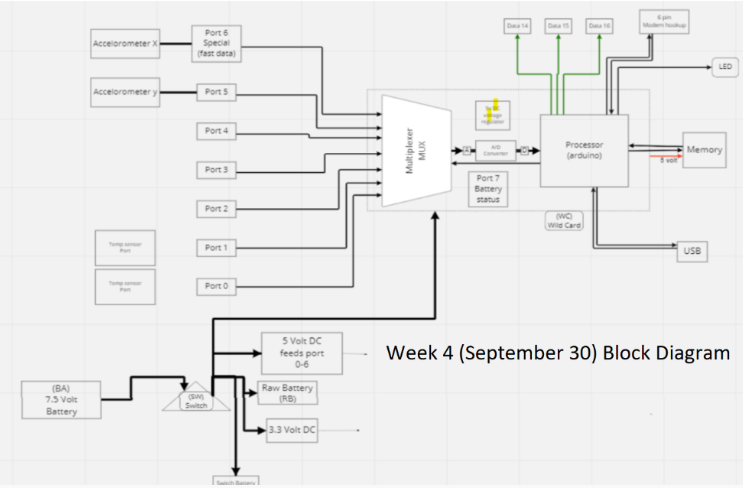
SYSTEM BLOCK DIAGRAM
First illustration of the system block diagram.
The teams constructed test payloads for drop tests and updated system block diagrams.
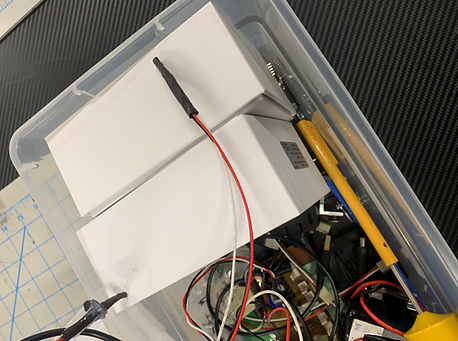
PAYLOAD TESTS
Drop testing the test payloads full of golf balls, updated system block diagram, and tested temperature sensors with dry ice.
GOLF BALL DROPS/ DRY ICE
Useing sensors to measure the temprature of colored cloth in sunlight.
COLOR TEMPERATURES
Week 4
Week 5
Week 6
WEEK 7
WEEK 8
WEEK 9
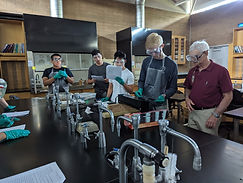
CALIBRATING SENSORS.
After testing, one sensor did not work, so we soldered a new one. The Run Cam did not work, but we fixed it. Moreover, the block diagram received an update. Additionally, we chose the shape for our payload. Lastly, we began early construction on the payload.
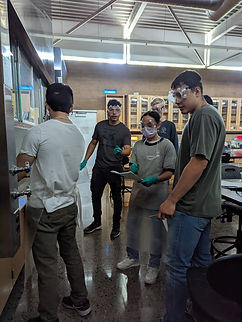
ENSURE ALL SENSORS WORK FINE. ATTACH COMPONENTS TO PAYLOAD.
We Tested all sensors but had issues with the accelerometer! Both axis stopped working properly.
FINAL TESTS AND HAND IN!
After getting a new one from Prof. Frank, we soldered it to new cables and tested it successfully.
We then started the stress tests, which included Ozzy and Tyler putting the payload in the fridge at school and shaking the fridge violently. Rik did Two 4-hour tests at his home, one outside and one in his freezer. He learned that the cameras got hot enough to melt the hot glue and a new mounting solution.

Both teams go to launch site
Going to launch site
Both teams retrieve payloads and upload data.
Launch day!
Final presentation this is a 30 minute presentation going over the data we get from our payload
FINAL PRESENTATION
FRIDAY
11/18/22
SATURDAY
11/19/22
12/02/22

Week 1
CIRCUIT BOARD ETCHING
Step 1
Step 2
Step 3

board. Furthermore, they put the glass plate on top of the artwork. They turned the UV lights on for 8 minutes. Lastly, they removed the glass and artwork and moved it to the hood. Brisa performed the second step. She put the board in the developer. After 30 seconds, she rinsed it out and brought it to Ozzy and Adrienne. Ozzy and Adrienne performed the final step. They placed the board in premade ferric chloride 6 inches above a light bulb for 20 minutes. Afterward, they dried it. Now the first circuit board was done, and we repeated the same step for the second one.
DRILLING HOLES
After etching, we drilled holes in the board. We took turns. The color on the circles indicated whether to use 0.6 mm, 1.0 mm, or 1-inch drill bits. The hole needed accuracy within a tenth of a millimeter. However, some did not line up. We fixed the issue by soldering and redrilling. In the end, drilling was a success!

Week 2
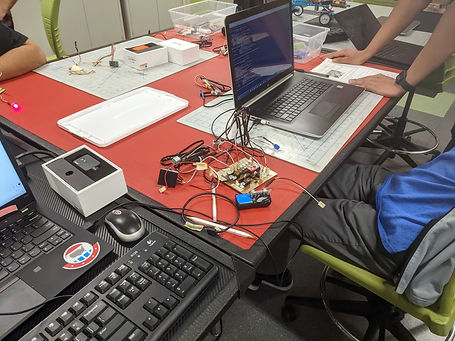
SOLDERING


Here, we soldered the electrical components onto the board. We practiced first. Using pieces of wood and a practice board, we soldered wires. We were now ready. We soldered the components onto the board. Using the diagram Rik, our team leader, made, we soldered the components accordingly and accounted for polarity.


Week 3
SYSTEM BLOCK DIAGRAM

We made a system block diagram; we included what we currently had from the previous one. The block diagram contained the ports for devices that we would later use to collect data. Additionally, we included the multiplexer that the ports connected too. The multiplexer receives voltages from the 7.5-volt battery not the ports. Furthermore, we included the analog/digital converter, processor (Arduino), and memory. The multiplexer receives the voltage and sends it to the analog/digital converter. The analog/digital converter sends the voltage to the processor (Arduino), which processes it and produces an output. The output goes to the memory and vice versa. In addition, we included the LED that communicates the payload's current state via flashes per cycle. Lastly, a 6-pin modern hook-up and USB was included. The USB connects the circuit board to the laptop via a cable that can be unplugged before the flight. Our block diagram included what we currently had.
COMPLETED BOARD BEING TESTED

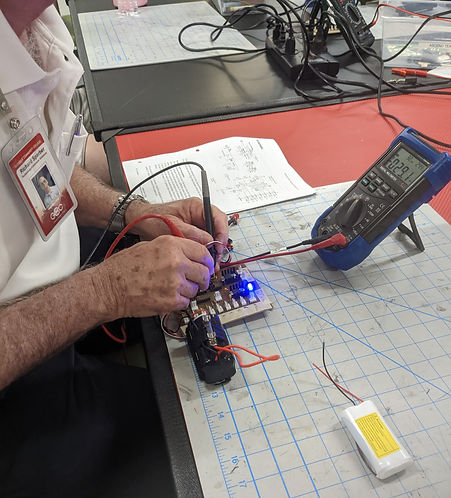
Here, we finished the board. Upon attaching the electrical components, we test it with a light bulb. The LED lights up confirming the board works!
Week 4
Payload construction
Updated system diagram below:
We updated the system block diagram. We added the accelerometers to measure the acceleration. Additionally, we added two temperature sensors which would later be four in ports zero to four. In addition, we added the wild card and data 14-15.
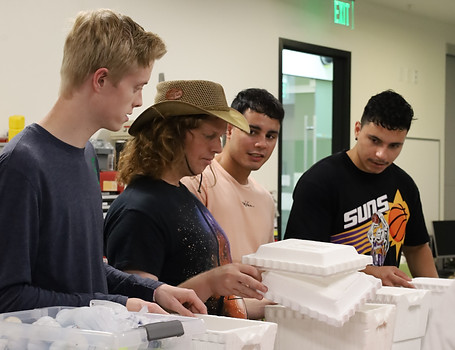
PAYLOAD PROTOTYPE CONSTRUCTION

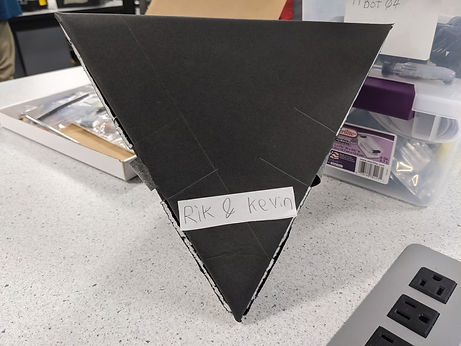
We built our test dummy payloads. The purpose was to familiarize us with building the payload. The goal was to maximize the size to fit as many golf balls as possible and throw them off the stadium. The shapes varied from a Pyramid and a tiny rectangle (Rik and Kevin), a cube (Shelby and Tyler), a rectangle (Jose and Genaro), and "The Bazooka" (Ozzie, Adrienne, and Brisa). We built a test dummy payload to destroy it.

WEEK 5
THE DROPS TESTS
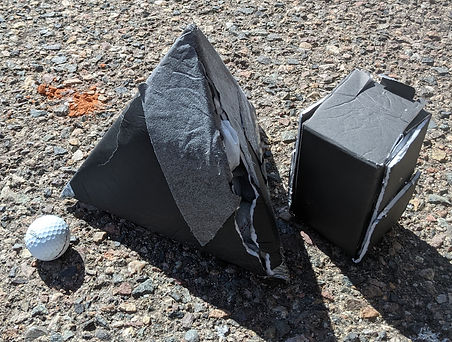

We dropped the prototype payloads with golf balls. All exploded but two!
TEMPERATURE READING


We tested the temperature sensors. Rick helped with the program. Upon downloading Tera-term, he gave us a manual that provided information for using the code. We then tested the sensors with dry ice. We connected the circuit board via a USB cable, displayed data using the O command, saved it, and exported it to excel. Since the ports displayed the voltage, we converted it to temperature in Celsius. We used the table to graph the data in excel. The temperature sensors were working.
SYSTEM BLOCK DIAGRAM (UPDATE #2)

We then connected the two temperature sensors to ports one and zero. Furthermore, we added the microphone we were unsure of at the time. We updated the block diagram a second time.

WEEK 6
TEMPERATURE READINGS WITH SENSORS IN COLORED FELT
Here, we tested the temperature sensors on colors. We went through the same process as the ice cube. The graph data we collected shows that the hottest to coldest was port zero, one, two, and three in that order.


WEEK 7
MAKING NEW TEMPRATURE SENSORS
We had issues with one of our sensors displaying the temperature of hot water as 600 degrees Fahrenheit and not working properly. To determine if the issue was port three or the sensor, we switched things and concluded that the sensor was the issue. To fix this, we soldered on a new sensor.

NEW SENSOR DATA
We tested both sensors. We used ice packs. The data on the left shows the temperature for ice packs. The thermometer for the ice packs initially read 64 degrees Fahrenheit before ending with 34 degrees Fahrenheit; the data concludes both temperature sensors work here. The data on the right shows the temperature for a hot heat pad. The thermometer for the hot heat pad initially read 174.9 degrees Fahrenheit before ending with 217.5 degrees Fahrenheit. The data concludes that both temperature sensors work here. Overall, both tests conclude that both sensors work.


RUN CAM
We had issues with the Run Cam. The black Run Cam was working, but the red Run Cam was not. Upon pressing the Wi-Fi/ Mode Switch, the expected flashing blue light was non-existent; no light, even the steady orange one indicating an error, appeared.
WHO DOES WHAT?
For detailed research in each portion of the project, we decided who would focus on what. Our four topics were; the RF receiver (if we get it), the accelerometer, the temperature sensor, and the pressure sensor. Rik chose the RF receiver since the RF receiver is an add-on he proposed following his research; Rik’s goal is to find where the radio frequency is strong and where the frequency is weak regarding the position of the weather balloon. Genaro chose the accelerometer because he is most familiar with how the accelerometer work. Genaro’s goal is to use the data regarding the accelerometer and graph it. To find the line of best fit (preferably a high degree polynomial), graph the position versus time by integrating the acceleration equation twice and comparing the height of the balloon with the data from the RF receiver, temperature sensors, and pressure sensors. Ozzie chose the temperature sensor because (Insert why and what your goal is. Note: I know you chose the temperature because you do not mind what you get, but try to come up with a reason). Tyler chose the pressure sensor because (Insert why and your goal).
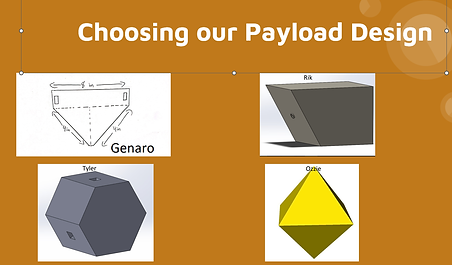
PAYLOAD DESIGN
Here, each team member proposed a design for the payload. Ultimately, we decided on Rik’s idea.

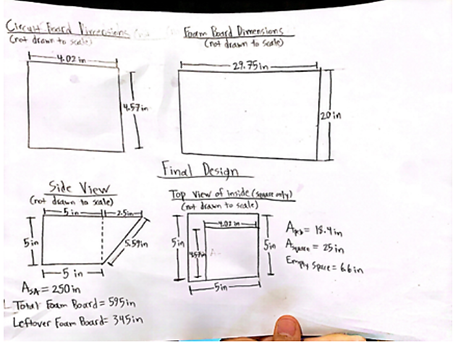
EARLY PAYLOAD CONSTRUCTION BEGINS!
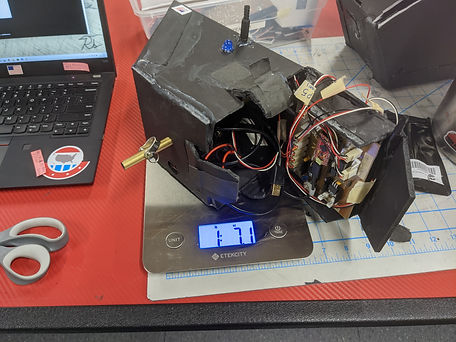
We began constructing the payload. Our goal was to have space for the circuit board. To do this, we had to decide the dimensions. Initially, we decided on a five by five cube. We used basic math to identify the extra space. Upon doing so, we scaled the drawing down to a five by five cube. Upon doing so, we found that the five by five dimensions accomplish the same goal as the six by six cube while reducing weight. We figured this out through basic math. First, we found the area of the circuit board (A = 18.4 in). We found the area of the foam board (A = 595 in). In addition, to calculate the amount of foam board we would use and the amount left over. We calculated the surface area of our payload (SA = 250 in. with 345 in. leftover). Lastly, we calculated the space by finding the volume of the cube portion of the payload and subtracting it from the area of the circuit board (Empty Space = 6.6 in). The results satisfied us, so we began construction. First, we drew the lines on the foam board. We cut lines with a hobby knife. Then we folded the lines that we were going to fold by using a piece of wood. Lastly, we hot glued the sides together with paper from extra foam. The payload weighed 1.08 pounds, including the electrical components and extra foam board, with the weight limit being 1.5 pounds. Ultimately, we finished constructing the payload housing.


SYSTEM BLOCK DIAGRAM (UPDATE #3)
We updated the system block diagram; we fixed issues from last week’s diagram. Firstly, we specified what two temperature sensors we had. As shown above, we have temperature number 7 on the outside and temperature sensor number 2 on the inside. Additionally, the triangle was not the symbol for a switch, so we made it a box. Moreover, we changed the raw battery to a switch battery because the camera does not have a separate battery; it runs on the battery. In addition, we changed 3.3-volt DC to a 3.3-volt regulator because we are converting voltage to a lower (direct current) constant voltage. Lastly, we moved port seven from below the analog-digital converter to the outside because port 7 is not in the processor; instead, port 7 is on the board.

WEEK 8
SENSOR CALIBRATIONS
TEMPERATURE SENSOR
Ozzie took the temperature sensor data to create an equation y = (mx+b) and ran a test for accuracy. Ozzie picked the highest and lowest point and used (y2-y1)/(x2-x1) to create the formula. Ozzie then estimated the room temperature. Using the equation, he picked the mid-point for room temperature, which read 75 degrees F. Afterward, to test for accuracy, he used a thermometer to measure the room’s temperature, which read 74.6 degrees F. The sensors were working.
PRESSURE SENSOR
Tyler analyzed the pressure sensor. Firstly, he collected data and noticed. Secondly, he created a simulation below.
ACCELEROMETER
Genaro wanted to calibrate and analyze the accelerometer. To calibrate, he wanted to ensure that the data read: (horizontally)àx-axis = 1 g and y-axis = 0 g. (Upside down)àx-axis = -1 g and y-axis = 0g. (Vertical on one side)àx-axis = 0 g and y-axis = 1 g. (Vertical on the other side)àx-axis = 0 g and y-axis = -1 g. Additionally, upon converting the data from voltage to acceleration using an equation Rik found (1/0.222((z-1.66)1000)-830/11)/981. Genaro wanted to ensure the x-axis plus the y-axis gave one or close to it. To analyze, Genaro would run tests to make sense of the numbers and notice patterns. However, the accelerometer did not work. The x-axis (port 5) worked, but the y-axis (port 6) failed. The y-axis displayed a constant voltage of 3.187v, the max output. To determine if the issue was the port we switched the sensors and determined the issue was the sensor. The accelerometer for the y-axis was dead. To fix the issue, we unplugged the port, took the plastic off while putting a black socket pin on the port, and soldered the end of the sensor to the black socket pin. The result was (Insert the results here).
PAYLOAD CONSTRUCTION
Rik progressed on the payload. He hot-glued the components appropriately.


LOGO DESIGN
Upon discussion, we decided on combining design. Rik used his drawing skills and software to give us the final design.


Final design (drawn by Rik B.) was a combination of everyone's ideas.


WEEK 9
FINAL WEEK / PAYLOAD HANDIN
REPLACING BROCKEN ACCELEROMETER.
After Prof. Frank gave Rik our new accelerometer, he went to work quickly to get it into our payload to test it. First, he had to decode the color coding from the wires that where already connected to the accelerometer and solder a plug with the correct color code onto those cables.
He quickly did that and ran a test to see if the accelerometer was outputting the correct voltages. He then calibrated it then handed it to Ozzy and Tyler for its first test.
THE ABUSE TESTS AND COLD TEST AT THE SAME TIME!
With Rik's lack of consent, Tyler and Ozzy stuffed the payload in the fridge and preceded to shake the refrigerator back and forth violently to get the first tests out of the way. as you can see below, the payload (and the fridge) experienced 3 Gs of force during this experiment, also the pressure dropped within the refrigerator, and the external temperature sensor also showed an accurate drop.

RIK TAKES PAYLOAD HOME FOR STRESS TESTING
Rik put the payload through two 4-hour stress tests (Saturday and Sunday), one outside (pictured below) and one in his freezer.
The payload ran successfully off a full charge for each of the tests.
Rik found issues with the camera mounts after the outside test. The mount's hot glue had melted, and the cameras moved out of place due to gravity. He used super glue to better secure these mounts and reran the test inside his freezer.
That test was quite successful!
Data retrieved from the stress tests


He returned it to school that Monday, where he (Rik), Ozzy, and Genaro had a team meeting and went over the checklist twice. Each person checked off completed items, and we then concluded that we were ready to turn in our payload to Prof. Frank.
PAYLOAD HAND-IN
When we handed the payload to Prof. Frank, he inspected it and told us, "good Job."
Good Job, Team Sky High! That includes Rik, Genaro, Ozzy, and Tylor for all their hard work and dedication to this project!
WEEK 11 (11/18/22)
Day Before Launch
We go to the forge and the hotel
Today after a short class, we went over the preparations for the trip. We went over packing checklists and got everything in order. Our trip to the forge was interesting. Our minds could not focusrd on that. We wanted to get to the hotel and prepare for launch day. Once at the hotel, we checked the launch day checklists, and charged our laptops and batteries. We then went down stares and shared our presentation.

After this and listening to all the other presentations we went to sleep.

WEEK 11 (11/19/22)
DAY OF LAUNCH
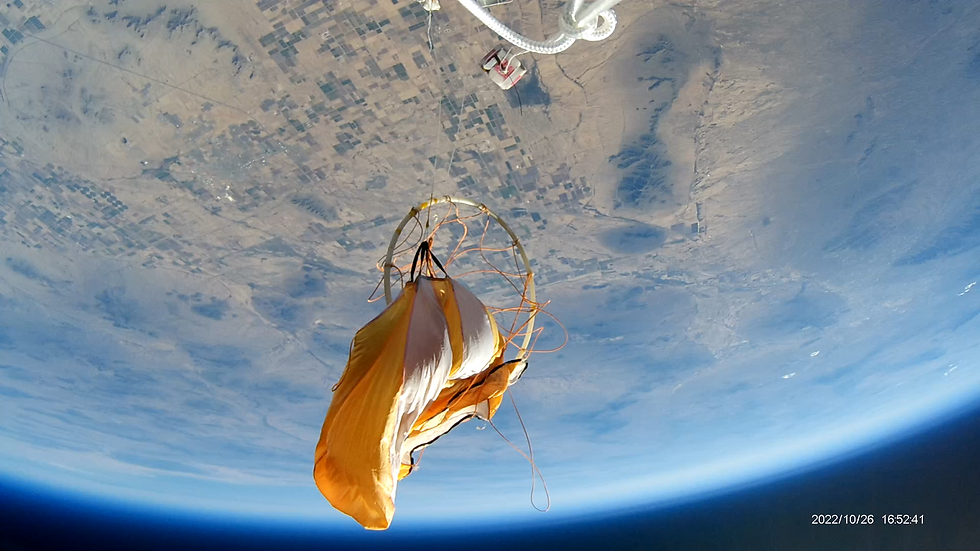
THE PLOAD IS LAUNCHED AND RECOVERED
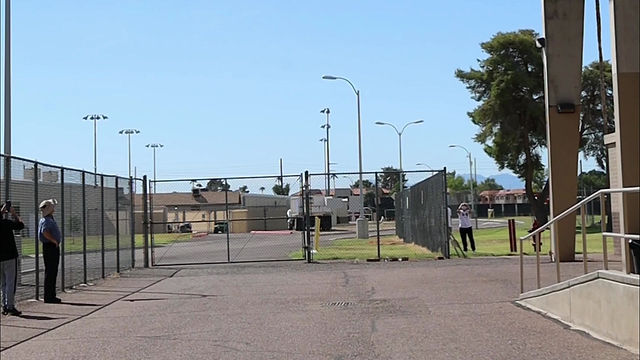
After getting up early and packing the van, we went to the launch site.
We witnessed the first balloon launch, which did not survive due to a parashot nonfunction. We were part of the second launch, which also had the same issue, but we landed in a tree.
First and second launch
Once the payload was off, we followed ANSR to a staging location. Then went to get our payload.
See details on the launch weekend (fall).
Once we got our payloads, both teams quickly discovered that the 4K run cams stopped working. Other teams said it was due to thermal overload.
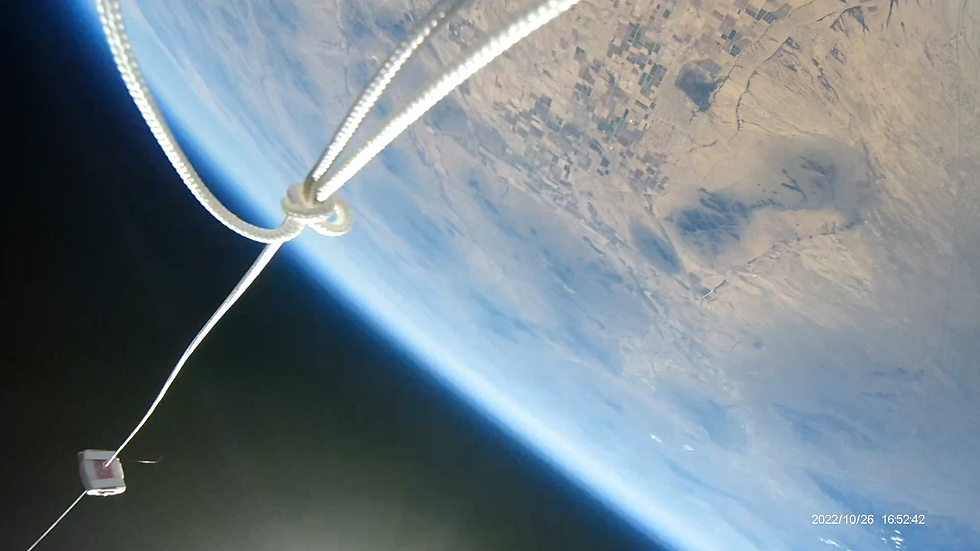
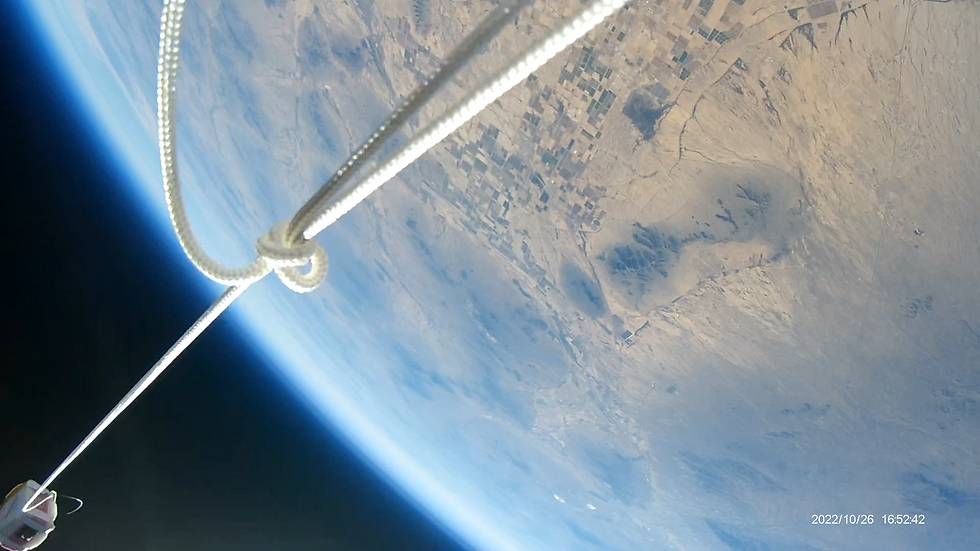
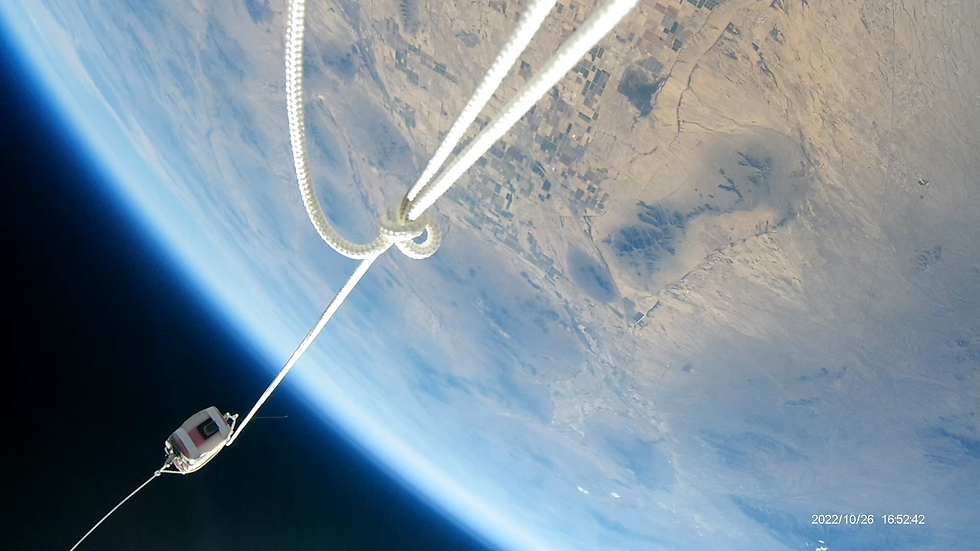
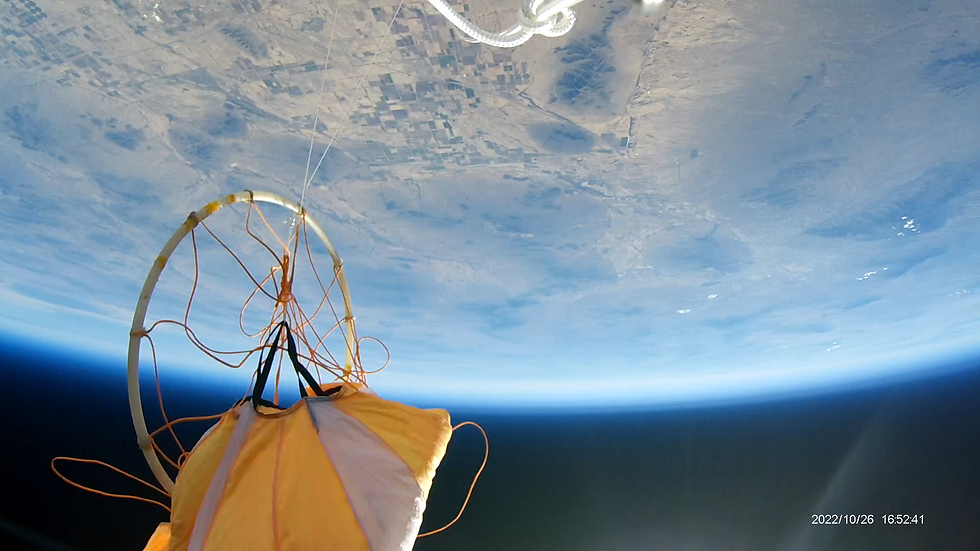
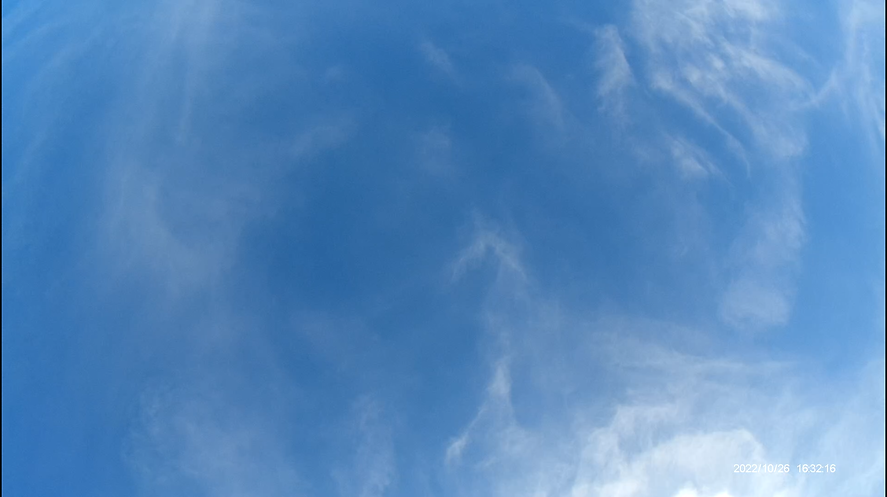
Data and video from HD camera.

As you can see, the view was quite stunning once we got up there, and the balloon popped. The pressure data also was interesting.
The pressure dropped to almost 0 Bar and then quickly rose, indicating a faster fall than when it floated up. The accelerometer was the most interesting because when the balloon popped, the forces experienced were beyond the ability of the sensor, indicating that we may need a sensor that can detect higher G forces. The temperature sensor was, as expected, warmer on the inside than on the outside. What was most interesting was the point where the sensor on the outside got hotter quicker than the inside. I think this was when the payload was in the tree.
After recovery (next week)
Later the professor emailed us, asking us to make another temperature sensor and tape it to the side of the 4K run cam to monitor it. Rik successfully assembled another temperature sensor and calibrated it. Then he duck taped it to the run cam.
He left it to Genaro to do the test the next day as the battery was still charging.
Genaro did the test and after about 22 minutes the camera failed at a temperature of 151 degrees F.

In conclusion, The run cam 4K is not designed for tight enclosed spaces like the payload stuffed with foam. The camera goes into thermal overload after just a few minutes. The odd thing is, the camera still generates more heat as if it is working, yet it does not record or save any video.
